[2022]Volume Flow v3 with alertsIndicators are an essential part of technical analysis of cryptocurrency. Their main function is to predict market direction based on historic price, cryptocurrency volume and other information. There are several types of crypto indicators illustrating various parameters (trend, volatility, volume, momentum, etc.) but in this article we will look at volume indicators.
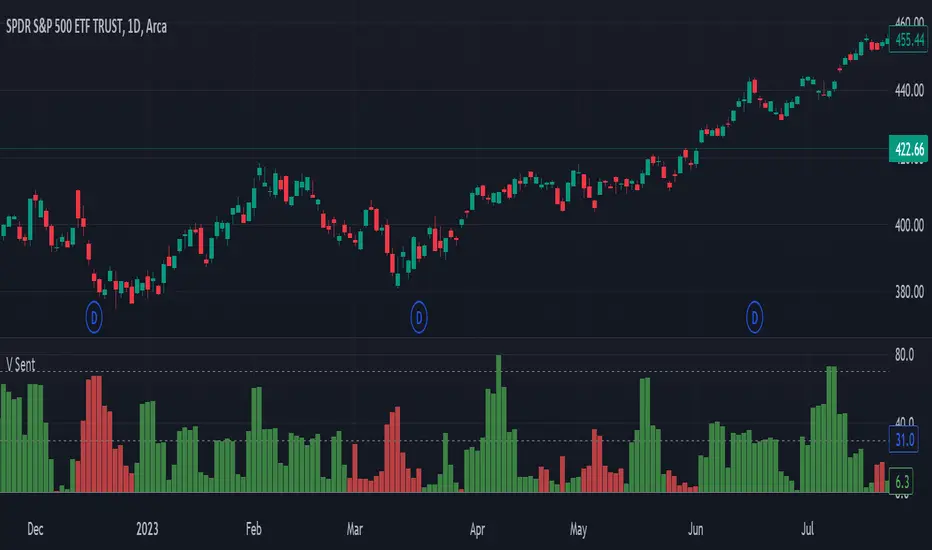
Volume indicators demonstrate changing of trading volume over time. This information is very useful as crypto trading volume displays how strong the current trend is. For example, if the price goes up and the volume is high then the trend is strong and will more likely last longer. There are various volume indicators, but we’ll talk about the most popular ones, such as:
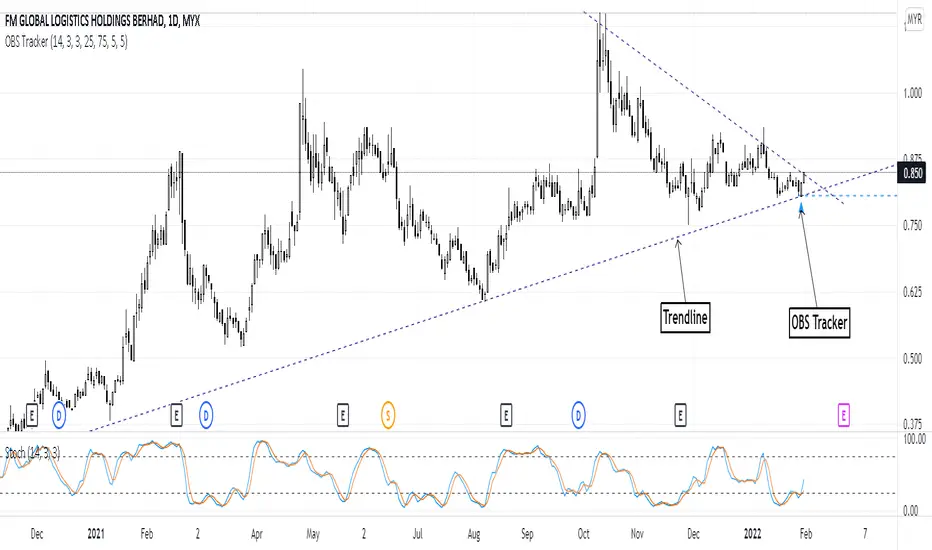
On Balance Volume
Accumulation/Distribution Line
Money Flow Index
Chaikin Oscillator
Chaikin Money Flow
Ease of Movement
Pine Script® Indikator